罗湖GDP增长乏力缘何?
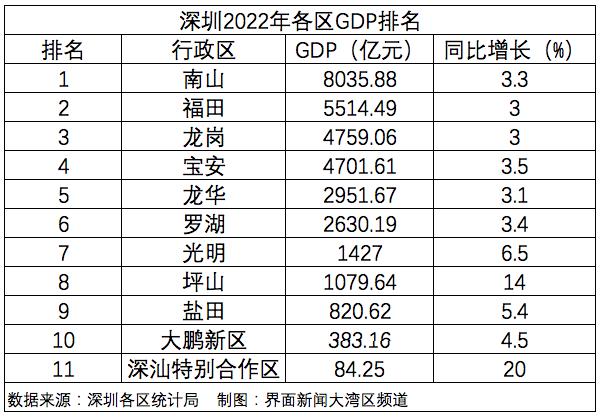
罗湖GDP越来越落后,20222年排名沦为第六,令人唏嘘不已。缘何?脱实向虚使然。
看看2022年,2015年,2012年,罗湖GDP的数据,令人深思,使人反省。

2015年深圳市各区GDP和人均GDP排名
GDP
排名城区2014年GDP(亿元)2015年GDP(亿元)2014年常住人口(万)人均GDP(元)人均GDP
(美元)人均GDP
排名01南山区3464.093714.57113.59327015.5852503.950102福田区2958.853256.24135.71239941.0538523.710208盐田区450.23487.2321.65225048.5036132.630310大鹏新区259.3274.5313.37205332.8332967.190405罗湖区1625.341728.3995.37181229.9529097.350509坪山新区423.99458.0733.15138181.0022185.630604龙岗区2321.252636.79197.52133494.8421433.250707光明新区632.77670.6650.42133014.6821356.160806龙华新区1497.81635.59143.45114018.1218306.170903宝安区2368.412640.92273.6596507.2215494.7010 深圳全市16001.9817502.991077.88162383.4726071.46
深圳GDP 2012年数据
1秒记住本站地址,深圳生活(szsh.org)
上一篇:
深圳这位男子肚子里刮出了一袋“黄油”!
下一篇:
外卖小哥的这些行为,有违社会公德